Greetings from sunny Las Vegas, Nevada!
I’m in town attending the Money Show investment conference and enjoying plenty of lively conversations with traders and investors.
Something came to mind during one of my conversations out here that I wanted to share with you. It’s a simple indicator that has helped me narrow down my trading ideas and zero in on high-probability opportunities.
It’s a very simple indicator. And you might laugh when you see the charts below.
But I promise you, paying attention to this simple metric has made a BIG difference in my returns over the years.
Good Things Happen Above the 200-Day…
If you’re an active trader, I want to encourage you to start watching the 200-day moving average for stocks you’re buying or selling.
And while you’re at it, go ahead and add the 50-day average to your charts as well.
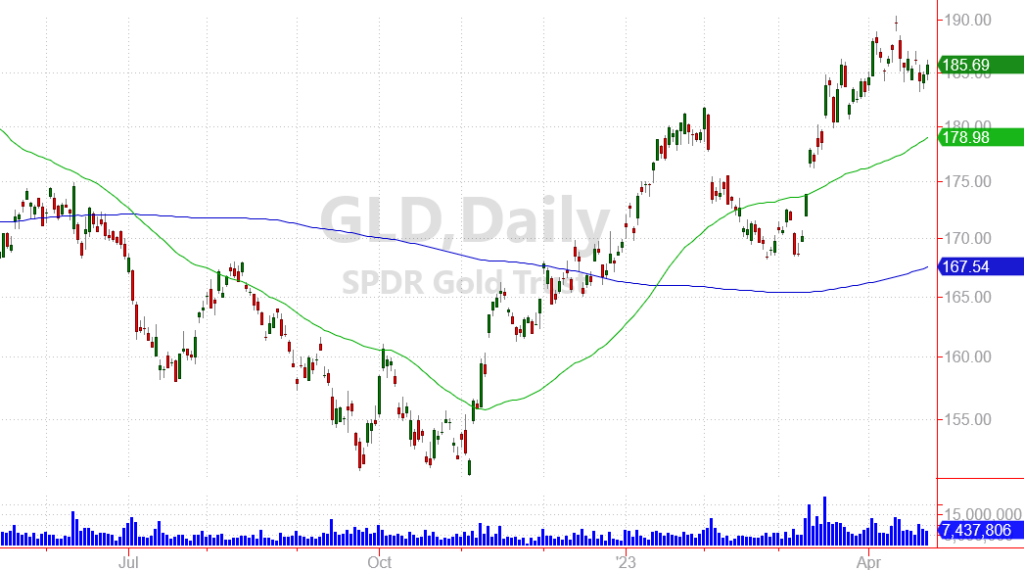
Here’s an example of the most basic chart I look at for most of my trades:

This is a chart of the SPDR Gold Trust (GLD) — an ETF that tracks the price of gold.
The thin blue line you see above is the 200-day moving average. This line tracks the average price over the previous 200 days. And it gives you a great idea of the long-term trend for any stock, commodity or fund on your watch list.
Similarly, the thin green line above is the 50-day moving average. This line moves more quickly (since it only measures the last 50 days of trading). And it can be a good indicator of the medium-term trend for a stock or other investment.
Here’s the thing…
GOOD things tend to happen ABOVE these lines.
When a stock is trending higher, it’s my experience that investors are more willing to buy…
Companies are more likely to report strong performance…
And just like physical inertia, stocks ABOVE these lines tend to continue trading higher over time.
So if you’re looking for bullish plays to buy, make sure you’re focusing on stocks that are staying ABOVE these two lines.
A few other stocks I’m watching above these lines include META, GOOG, ORLY.
In fact, I’ve got some aggressive bullish positions in all three stocks – as part of my Speculative Trading Program.
Bad Things Tend to Happen Below These Lines…
On the flipside, when a stock is trading below these trendlines, any new surprises tend to send stocks sharply lower.
This makes sense when you think about it…
Stocks below these trendlines have already started trading lower because traders are sniffing out weakness for these particular plays. So when these companies announce earnings — cut prices on products — or fire executives — it tends to drive the stock price even lower.
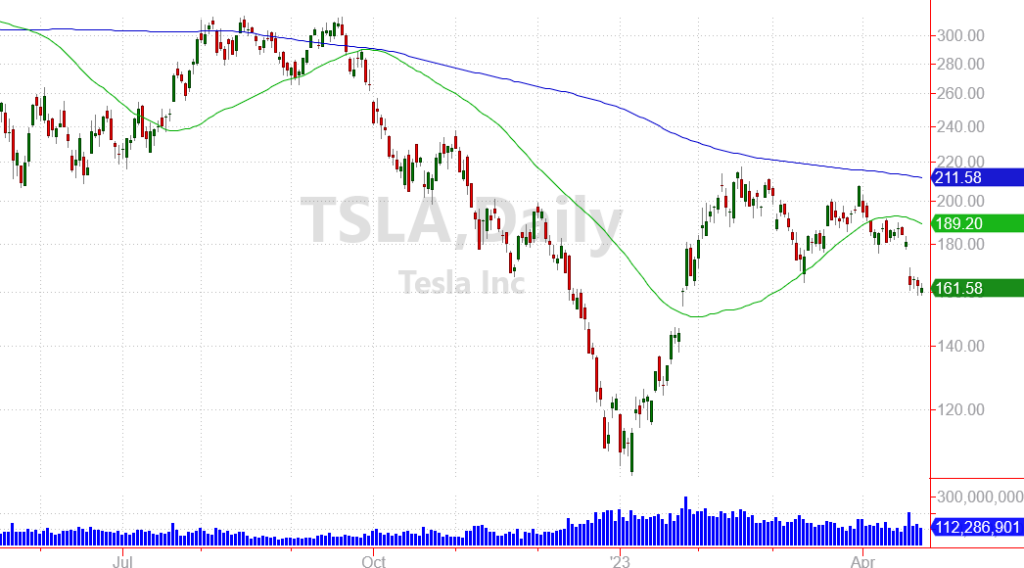
The stock chart for Tesla Inc. (TSLA) is a good example of this kind of trend.

The stock has been trading below it’s 200-day average for months now. And investors were already concerned after seeing Tesla cut prices for it’s most popular vehicles.
When TSLA reported earnings last week, the stock gapped lower and may still have much farther to fall. The trend is clearly against TSLA right now. And my Speculative Trading Program is profiting from another round of bearish plays on the stock.
Using Moving Averages to Enhance Your Trading
Obviously the 50-day and 200-day moving averages aren’t “magic” indicators. And they’re actually fairly simple tools compared to some of the bells and whistles other traders use.
But sometimes simplicity can be more useful than complexity — especially when it comes to market trends.
I don’t use these indicators as “hard-and-fast rules” for my trading.
But I DO pay attention to these trendlines as part of my overall research process.
If you’d like to see how I use these lines in my real-money trading account, you should check out my Speculative Trading Program.
This program takes aggressive positions on stocks I expect to trade higher or lower. And since I make both bullish AND bearish trades, the program can profit from stocks trading higher AND from stocks trading lower.
Last year, this trading program logged a 190% gain.
The program uses a high-risk / high-potential-reward approach which isn’t suitable for everyone. And the program DOES have periods of losses.
But over time, I’ve been able to use simple indicators like moving averages — along with my research on specific companies — to lock in some attractive gains.
You can trade alongside me simply by joining the Speculative Trading Program.
For just $147 a month, you’ll receive real-time trade alerts for each of the aggressive trades I make. I’ll give you a chance to enter your trade before I place my own trade. And of course I’ll also send you an alert before I decide to exit each position.
>>Try the Speculative Trading Program here<<
As I mentioned, the program isn’t suitable for everyone. So if you try the program out and decide it’s not for you, no worries.
The program comes with a 30-day refund period. I’m happy for you to try it out, and decide whether you want to continue trading alongside my real-money account or not.
Please check it out! I’d love to help you thrive in this challenging market environment.
Here’s to growing and protecting your wealth!
Zach
