
Over the holidays a friend asked me if I paid attention to stock charts.
I could tell by the tone of his voice that he didn’t think they were worth much. So I managed to sidestep the question and pretty soon we changed the subject.
But between you and I, my views on stock charts have come a long way from when I started my investment career at a hedge fund in the financial district of Atlanta.
This week as I start building out trading and investment positions for 2022, I’ve got my eye on a three ominous stock charts. All three of these stocks are forming (or have formed) “death cross charts.”
I want to explain why that matters, how to avoid the risk in play, and how you can even profit from these unique chart patterns.
Why Stock Charts “Work”
Many fundamental investors despise chart patterns and people like me who watch them.
I’ve come across plenty of these characters throughout the years, and I understand the way they think. Here’s their argument:
All stocks will ultimately be worth the value of profits that the companies generate. So there’s no point in watching which way a stock is trading in any given day, year or month.
From an academic perspective, they’ve got a point. And if I was going to hold a stock forever, it certainly wouldn’t be worth taking much of my time studying where traders have been buying or selling over the past year.
But think about this…
The market is made up of buyers and sellers — individuals who are influenced by greed and fear just like you and me. They have bills to pay, bonuses to earn, retirements to save for and dreams to chase. And all of those factors influence where and when people will buy or sell shares of stock.
Historical chart patterns plot when and at what price people have previously bought or sold. And if you pay attention to these levels, you can more accurately predict when human instincts are going to kick in and trigger new buy or sell decisions.
Anyway, that’s a long-winded way of saying that I think there are some great reasons to look at chart patterns. In fact, I’ve created an entire watch list product to keep track of the most actionable stock charts on my radar.
An Ominous “Death Cross Chart” Spells Trouble
One of the most dangerous chart patterns I’ve been seeing lately is the infamous “death cross chart.”
A “death cross” forms on a stock chart when one short-term moving average crosses below a longer-term moving average.
Here’s an example…
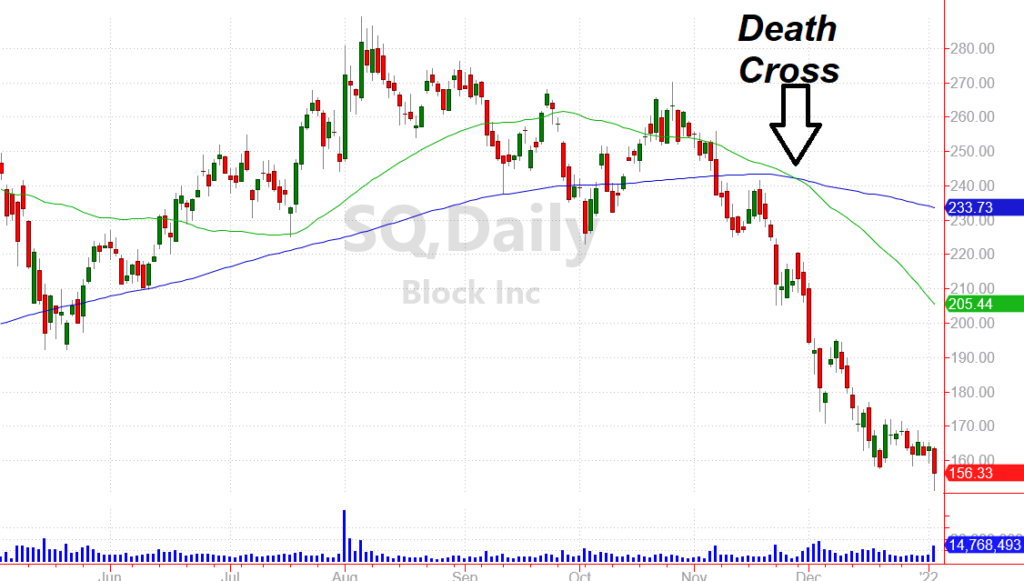
In late November, shares of Block Inc. (SQ) had already begun to break down. That’s when the stock’s 50-day average (the green line) crossed below the stock’s 200-day average (the blue line).
This “death cross” indicated the short-term trend for SQ had officially broken down. And it signaled active traders to get out of the stock (and to possibly start building bearish positions to profit from a fall).
Sure enough, SQ continued lower and could still have much farther to fall. After all, the stock is trading at a high valuation compared to earnings. And many short-term speculative traders are now caught in losing positions (and will be sellers for weeks to come).
Now there’s nothing “magic” about death cross charts — or any other technical indicator for that matter.
But since other traders pay attention to stock charts and specific patterns, setups like this can become self fulfilling. As traders see a death cross chart forming, they’re more inclined to sell. And that can lead to more pressure on the stock driving shares even lower.
Considering the weakness that’s creeping into certain areas of the market, I wanted to point out a few death cross charts to help you avoid potential trouble.
Moderna Inc. (MRNA) – After a Spectacular Run
Shares of Moderna Inc. (MRNA) made investors a lot of money following the company’s successful rollout of its coronavirus vaccine. In fact, the beta version of my Speculative Trading Program locked in some big gains on MRNA calls when it surged higher last fall.
But now vaccinations are reaching critical mass. Therapeutics are helping to minimize health risks. And investors are starting to look at the rest of MRNA’s business.
And while the company certainly runs a legitimate business, profits are expected to decline significantly over the next couple of years.
Two years ago, MRNA was just a twenty-dollar stock. And while the company’s vaccine platform is certainly more valuable now, questions about the company’s long-term value remain.
Perhaps more importantly, many investors who bought shares during the height of the crisis are now trapped in a losing position. If you’ve ever been in that situation. you know that any time your stock starts to bounce, there’s a temptation to sell.
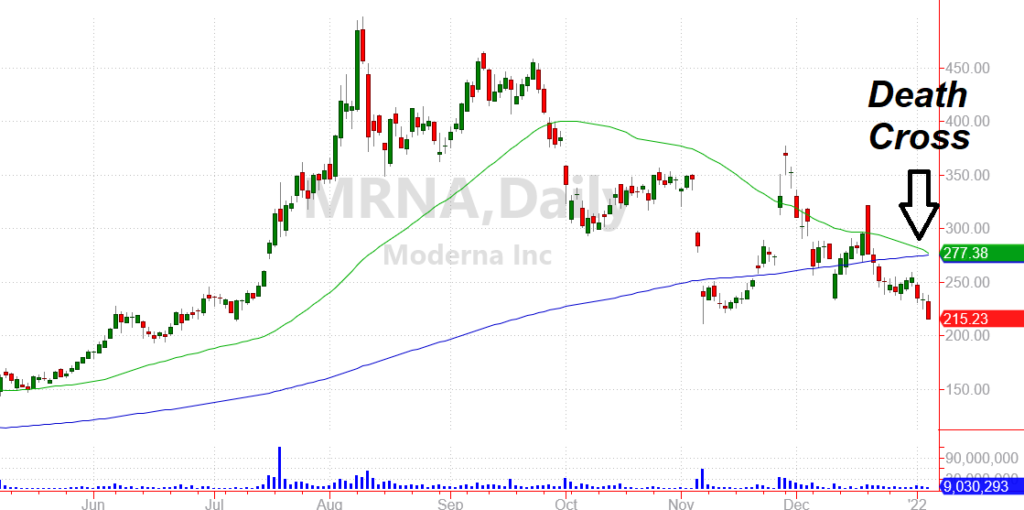
MRNA’s death cross chart is just now forming as the stock breaks a key support level near $220. This breakdown could lead to a more sustained selloff as investors panic and bail out of their positions.
If you’re a conservative investor, you may want to exit this position even if you plan to hold long-term. You’re likely to get a much better entry point in a few weeks.
And if you’re a more speculative trader, this death cross sets up a good opportunity to short the stock or buy put contracts. Based on the current action, it looks like the odds favor a much lower price for MRNA this year.
Will Meme Stock AMC Hit Single Digits?
While Moderna at least has a legitimate business, shares of AMC Entertainment (AMC) shot higher on nothing but a well-orchestrated market manipulation tactic.
Individual traders bought with the intention of squeezing short sellers. And for a while, they succeeded.
But stocks of unprofitable companies can’t stay elevated forever. And AMC’s day of reckoning appears to be here.
The stock has started giving back last year’s gains. And as panicked investors start to bail out of positions, the negative momentum could pick up quickly.
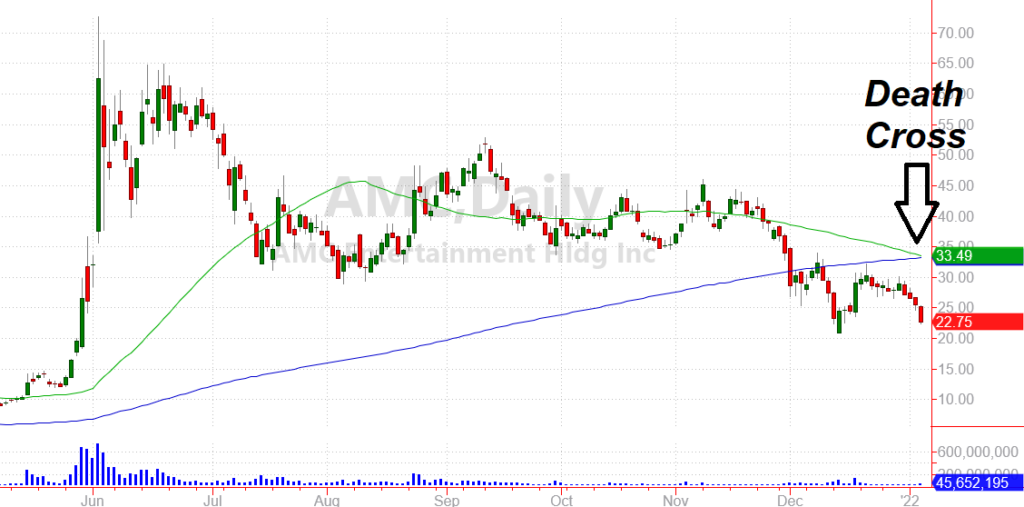
Full disclosure, now that AMC has begun trading lower, I’ve taken a bearish position in the Speculative Trading Program. Buying in-the-money puts on AMC gives me the ability to profit from a decline, while at the same time muting my risk if the trade winds up being premature and AMC rebounds.
For now, AMC’s breakdown along with the death cross chart make this a high-conviction trade to kick off the year.
These are just two of the death cross charts that are evolving in today’s market. But if you look back through charts of popular stocks that have fallen in recent months, you’ll see this pattern showed up for many of them prior to the biggest part of their decline.
To be a successful investor and trader in today’s market, it helps to have as many tools in your belt as possible. Understanding the fundamental dynamics for every business is helpful. And watching the charts for key patterns like the death cross can also help you make smart decisions.
Here’s to protecting your wealth in 2022!